INTRODUCTION
A Listed company refers to company whose share are trading on an authorised or official stock exchange. Financial comparison between two or more listed companies are required to take signifiant investment decisions. Such comparative analysis is vital to choose best appropriate company out of several alternatives (Edwards, 2013). Comparison is done by covering various financial aspects like accounting ratios, views of company's shareholders to evaluate financial performance and financial position of different companies. This report describes a financial comparison of two listed companies: The Go-Ahead Group Plc and Barratt Developments Plc. Both these companies are belongs to different sectors but listed on same stock exchange. This report also covers discussion on financial and non-financial factors that may affect these companies' performance.
TASK
1. Overview of Companies:
The GO-Ahead Group Plc belongs to Travel & Leisure service sector and provider of passenger transport in United Kingdom. Company provides transportation services through three segments: Local Bus services, London Bus services and Rail. Company is also engaged in offering rail replacements and other contracts based services. Company's bus segment provides deregulated services in North East, south east, southern England and regulated services in London.
Barratt Developments Plc is UK's one of the leading residential property development company and operating its business through approx 30 Divisions. Company is engaged in purchase or acquisition of lands, accessing planning consents and construction of rich quality homes. Company builds and constructs rich quality homes as per criteria of rating of HBF five star. Company's key operation is construction of residential house and commercial buildings in UK.
2. Analysis:
Generally financial analytical tool is use by business organisations for analysis of various financial and non-financial aspects. Most popular and widely used tool for financial analysis is Ratio analysis (Fourie, 2015). It is a systematic formula based financial analytical tool in which various ratios are calculated by business organisation to measure liquidity position, profitability condition, leverage of firm etc. These accounting ratios are calculated by using data of annual report and financial statements. Ratio analysis provides a comparison of performance of company in related industry and helps to determine year to year performance of company. Ratio analysis also provide a framework for comparison of two or more companies concerned with different-different industries. As Go-Ahead Group Plc and Barratt Developments Plc are two different sector companies but through ratio analysis shareholder can evaluate companies' performance and take decision regarding purchase or sell of securities. Accounting ratios are further classified as: Liquidity ratios, Asset Turnover ratios, Financial Leverage ratios, Profitability ratios and Dividend policy ratio. Following are various accounting ratios for three years of selected companies, as follows:
- Liquidity Ratios: It refers to accounting ratios that points out towards a business organisation' ability to pay its current liabilities or obligations. These ratios helps to describes liquidity position of company.Following are the major liquidity ratio:
- Current ratio:
|
|
|||||
|
Current Ratio |
|||||
|
The Go-Ahead Group Plc |
Barratt Developments Plc |
||||
|
2018 |
2017 |
2016 |
2018 |
2017 |
2016 |
|
1.09 |
0.85 |
1.06 |
3.7 |
3.25 |
3.3 |
|
|
|
|
|
|
|
It is a kind of liquidity ratio that helps to measure company's ability and efficiency to pay out its current liabilities or short term obligations. 2 : 1 is considered as ideal current ratio. From above current ratio table it is clear that Barratt Development has current ratio above the ideal ratio which are 3.7,3.25 and 3.3 in year 2018,2017 and 2016 respectively. Current ratio above ideal ratio indicates that desirable situation is achieved. Where as current ratio of Go-Ahead Group Plc is below the ideal ratio which are 1.09,085 and 1.06 in year 2018,2017 and 2016 respectively. Current ratio below the ideal ratio indicates that company is not able to generate current assets to pay its current obligation.
- Quick Ratio:
|
Quick Ratio |
|||||
|
The Go-Ahead Group Plc |
Barratt Developments Plc |
||||
|
2018 |
2017 |
2016 |
2018 |
2017 |
2016 |
|
0.88 |
0.74 |
0.95 |
0.78 |
0.59 |
0.57 |
It is used to measure organisation's ability to use its quick assets to pay its current liabilities. Quick assets includes cash, trade receivable, other marketable securities but not inventory (Hale, Hale and Held, 2012). Ideal quick ratio is considered as 1 : 1. In case of both companies quick ratio is below the ideal ratio but In Barratt Developments Plc quick ratio is 0.78 in 2018 and having increasing trend over the three year, where as The Go-Ahead Group Plc has quick ratio of 0.88 in 2018 and having decreasing trend. However in 2018 ratios indicates that Go-Ahead is more efficient to use its quick asset to pay its current obligation.
- Profitability Ratios :These ratios helps to measure actual profitability position of a business organisation. These ratios describes company's efficiency to earn profit during a particular period. Following are the key profitability of selected companies:
- Net Profit Margin ratio:
|
Net Profit Margin |
|||||
|
The Go-Ahead Group Plc |
Barratt Developments Plc |
||||
|
2018 |
2017 |
2016 |
2018 |
2017 |
2016 |
|
2.57% |
2.56% |
2.07% |
13.78% |
13.24% |
12.99% |
This ratio exhibits company's efficiency to generate net income after deducting all business expenses. In Go-Ahead net profit margin ratio is 2.57% in year 2018 whereas in Barratt Development ratio is 13.78% which indicates that Barratt Developments is more efficient to provide net profit on total turnover. There is increasing trend in net profit margin ratio due to increase in net profit over the three years.
- Gross Profit Margin ratio:
|
Gross Profit Margin |
|||||
|
The Go-Ahead Group Plc |
Barratt Developments Plc |
||||
|
2018 |
2017 |
2016 |
2018 |
2017 |
2016 |
|
7.64% |
7.68% |
7.50% |
20.70% |
20.00% |
18.90% |
It helps to measure company's effectiveness to generate income after cost of goods sold. In Go-Ahead Group gross profit margin ratio is 7.64% where as in Barratt Developments it is 20.70% which indicates that Barratt is more efficient to provide income after cost of goods sold. There is slightly decrease in gross profit of Go-Ahead in 2018. But in Barratt there is upward trend in gross profit ratio.
III. Financial Leverage Ratio: These ratio provide assistance to measure company's ability to pay its long term obligations or loans such as payment of interest expenses, instalment payment and payment other fixed long term obligations. Major financial leverage ratio are discussed below in the context of both selected companies:
- Debt Equity Ratio:
|
Debt to Equity Ratio |
|||||
|
The Go-Ahead Group Plc |
Barratt Developments Plc |
||||
|
2018 |
2017 |
2016 |
2018 |
2017 |
2016 |
|
1.37 |
0.78 |
1.83 |
0.04 |
0.04 |
0.04 |
This ratio is kind of financial leverage ratio that exhibits proportion or structure of debt and equity in company. 2:1 is considered as ideal debt to equity ratio. Ratio above the ideal ratio indicates that company is not able to generate cash to pay its overall debts. As per above table it has been analysed that Both companies has reported ratio below the ideal ratio which is favourable condition. However Barratt Developments has reported ratio of 0.04 in year 2018 which is more effective ratio as compare to Go-Ahead i.e.1.37.
- Debt to Total Assets:
|
Debt to total asset ratio |
|||||
|
The Go-Ahead Group Plc |
Barratt Developments Plc |
||||
|
2018 |
2017 |
2016 |
2018 |
2017 |
2016 |
|
0.23 |
0.1 |
0.2 |
0.03 |
0.03 |
0.02 |
This ratio assist to measure proportion of assets are funded by long term loans and debt funds. High debt ratio leads to high leverage which results in financial risk. From analysis of both company's ratio it is clear that Barratt Developments plc has most favourable leverage ratio because company has reported debt ratio of 0.03 in 2018 where as Go-Ahead has reported ratio of 0.23 in 2018.
Above ratio analysis is signifiant to compare financial performance of both companies to take decision regarding whether to hold securities of selected companies or sell. Following is a table which summarizing all the results of above ratio analysis done above:
|
Basis of Comparison |
The Go-Ahead Group Plc |
Barratt Developments Plc |
|
I. Liquidity Position |
Overall liquidity position of company as compare to Barratt is not so good. Company also has current and quick ratio below the ideal ratio which indicates unfavourable liquidity position of company (Hall, 2012). |
Company's current ratio is above the ideal ratio and overall liquidity ratios are better than Go-Ahead Group. Therefore Company's liquidity condition is good. |
|
II. Profitability |
Aggregate profitability condition of company is good but as compare to Barratt Development company's profitability condition is poor. |
Company's profitability position is better because company is able to generate profits more efficiently as compare to Go-Ahead. |
|
III. Financial Leverage |
Company's overall performance in financial leverage is quite good. But not so goods as compare to Barratt. |
As comparison of both companies, Barratt's financial leverage position is better. |

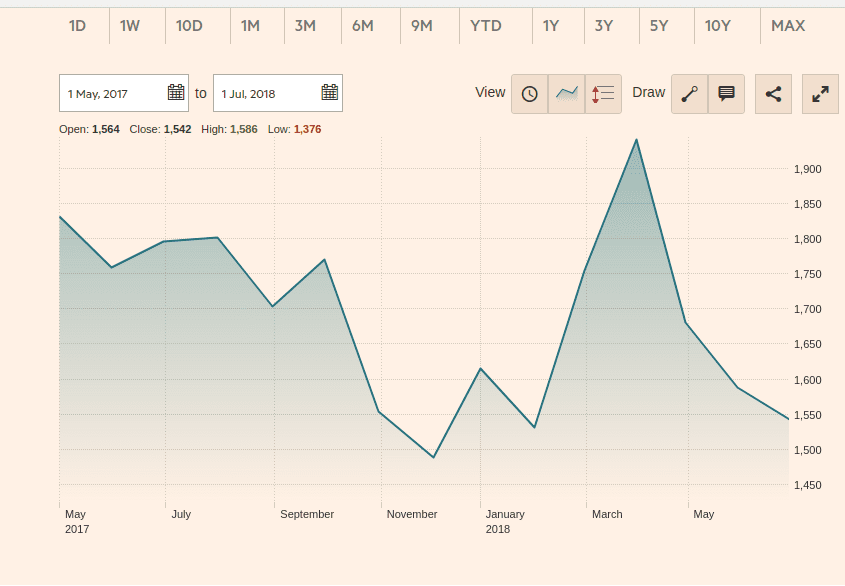
(Source: Performance chart of Go-Ahead Group Plc, 2018)

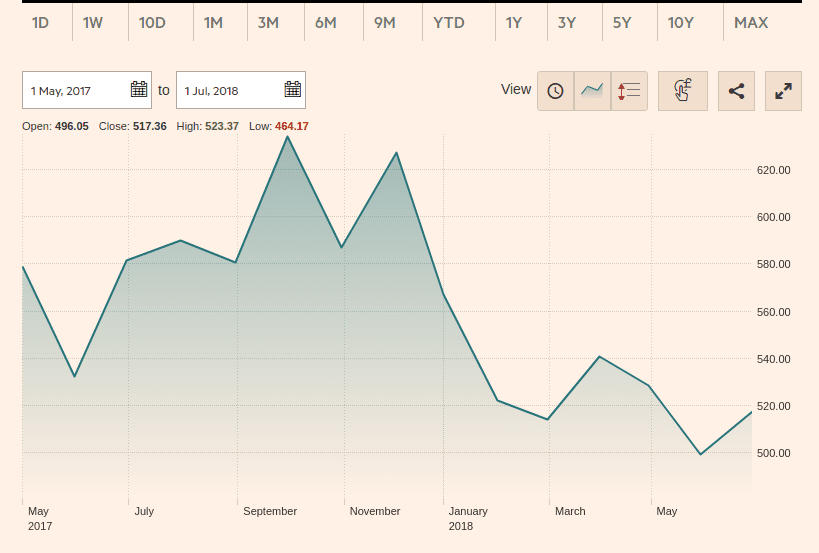
(Source: Performance chart of Barratt Developments Plc, 2018)
3. Performance Factors:
Performance factors are those financial and non-financial factors that affects company's performance in short term or long term (Dimitropoulos, Asteriou and Siriopoulos. 2012). Every organisation has its own influential factors so analysis of these factors helps shareholder to make important decisions. Following are the performance factors that affects selected companies, as follows:
Financial Factors: Financial factors includes company's net income, cost of goods, operating expenses, overall interest expenses, inflation effect on sales etc. Following are the financial factors that affects selected companies performance, as follows:
The Go-Ahead Group Plc: Company's overall turnover shows a decrease in previous year due to inflations and Brexit effect which ultimately leads to decrease in net profit of company. Company's decreasing return on investment is also a financial factor which affects its financial pe


 Company


