Introduction
The John Lewis partnership is a visionary and successful business. It begins trading in 1864 on London Oxford street. Now it grew up and became the largest Omni chain retailer in the UK. Further, John Lewis announced that it will open 10 new stores in another smaller format. Apart from this, some challenges which were faced by John Lewis is related to lack of new technology (de Lecea, Cooper and Smit, 2016). For solving this problem firm introduce new technology which helps to meet the needs of the customer. Its main aim is to keep its customer satisfied and it focuses on providing excellent services to its customer. Now John Lewis can meet this challenges and continued to succeed.
Ratio of John Lewis
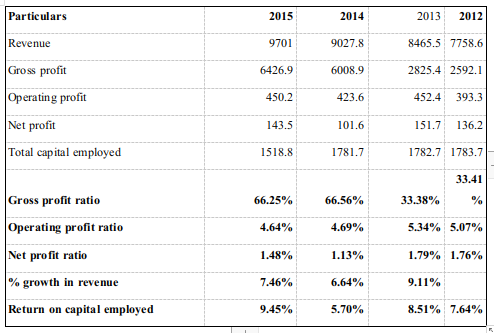
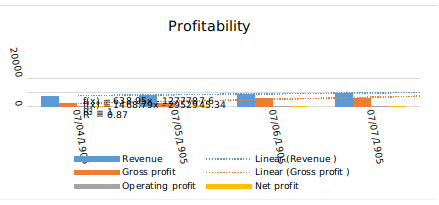
Gross profit of John Lewis company is can be determined after deducting the cost which is associated with making and selling the product. Gross profit of John Lewis company in 2015 is 66.25%, in 2014 is 66.56% and in 2012 is 33.41 %. It shows that company gross profit increases in 2015 and 2016. This means company profit is increasing every year.
Operating profit is that profit which company earned by its normal business operation. There is no value cover in any profit earned from the firms' investment. Hence, above table show operating profit ratio of John Lewis company is decreases in 2014 and 2015 as compare to 2012 and 2013. It shows company needs to improve its normal business operations so that it can easily earn operating profit.
Net Profit Ratio
The net profit ratio is that ratio which came after deducting the tax profits to net sales. The net profit ratio also shows link between net profit after deduction of tax and sales. John Lewis company net profit in 2015 is 1.48%, 2014 is 1.13%, 2013 is 1.79% and in 2012 is 1.76%. it shows that profit is high in 2012 and 2013 and in 2014 it decreases. But in 2015 company net profit is increased as compare to 2014.
Return on capital employed: It is a ratio which measures the company profitability and the efficiency with which its capital is engaged. If there is higher ratio, then it indicates more effective use of capital.
John Lewis company return on capital employed ratio is 9.45% in 2015 and in 2013 it was 7.64%. in 2012 is 7.64% and in 2014 it was 5.70%. This show that 2015 company return on capital employed ratio is high which means John Lewis is efficiently using its capital.
Operating Expense to Revenue: The operating expenses to revenue ratio is equal to operating expenses divided by its revenues. It is a cost which is associated with running core business on daily basis. Along with this if there are lower operating expenses then it will generate more profit. John Lewis company operating ratio is 30% in 2015 and in 2014 it is 29% while from 20122 to 2014 it is continuously same and in 2015 it increases. This show that company is earning a high profit in 2015 because it operating expense ratio is high
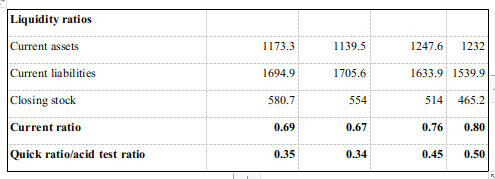
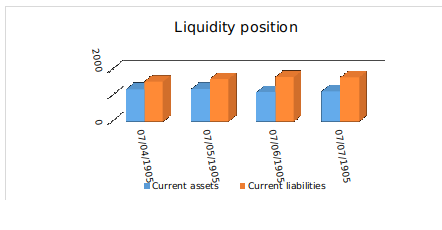
Current Ratio: The current ratio is referred as a liquidity ratio which shows the ability of the company to pay short term and long term obligation. The current ratio of John Lewis company is 0.69% in 2015, in 2014 it 0.34 %. It shows that it is not much different in both years in current ratio.
The quick ratio is that ratio which shows capability of the company to meet its short-term liabilities. In 2015 Quick ratio of John Lewis company is 0.35% and in 2014 it is 0.34 % while in 2013 and 2012 it is 0.45% and 0.50%. This show that company in 2015 is not much capable of meeting the short-term capabilities as compare to a year in 2012 and 2013.
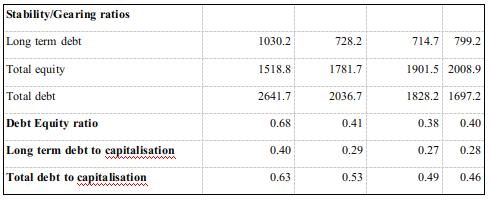
The Debt-Equity Ratio: Debt equity ratio is that ratio which used to measure a company financial leverage. in 2015 John Lewis company debt-equity ratio is 0.68% and in 2014 it is 0.53%. as from the above report, it is clear that company earned capabilities of paying the debt in 2015 is high as compare to 2014.
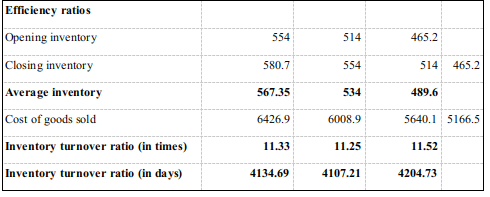
Inventory Turnover Ratio: It is a ratio which show that how many time company sold its total raw -material. In 2015 John Lewis company inventory, turnover ratio is 11.33% and in 2014 it is 11.25
The purpose for using techniques and method for ratio analysing so that company final position can be identified (Kogadeeva and Zamboni, 2016.). Ratio analysis is based on line items in a financial statement such as balance sheet and income statement and cash flow statement. Further ratio analysis also help in evaluating the various aspects of a company.
Table 1: Income Statement of John Lewis Partnership
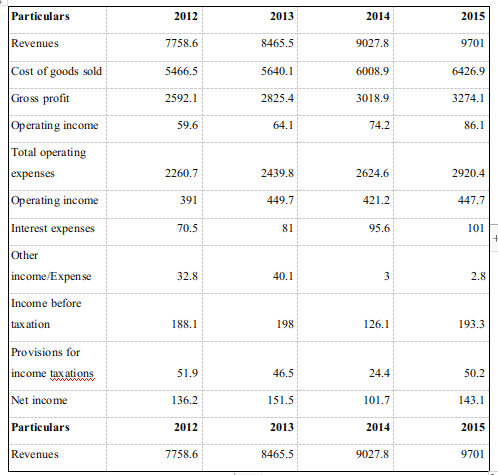
Table 2: Vertical Income Statement
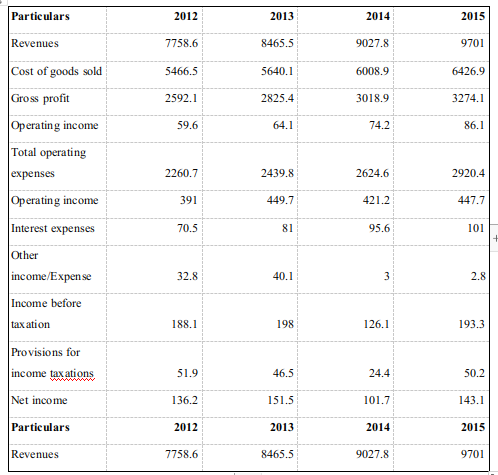
Interpretation: The aforementioned table shows that gross profit increase in 2015 which reflect that company has controlled its direct expense this lead to increase in profit. While the net income of company increases but its growth rate is very slow which show that company does not have any control on its direct indirect expense.
Table 2: Horizontal Income Statement
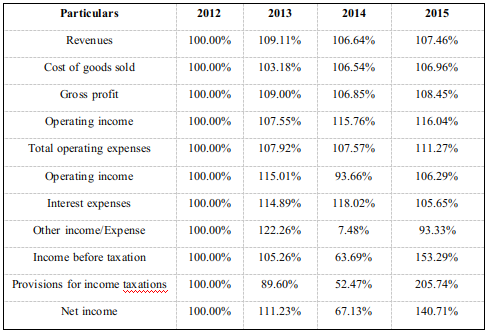
Interpretation: From the aforementioned chart show that in horizontal income statements revenues decline in 2015. On the other hand, other expenses decline in 2015 which show that John Lewis company have control on its expenses. Further, Interest expenses decrease in 2015 which show that company pays debt on time.
A.)
Discuss the reason given in annual report and additional factors obtained
The annual report is chosen for getting detailed information of John Lewis company. This annual report was selected because in this report detailed information is provided for company financial stability, the ratio of the company and other information. There is the different method used for calculating the ratio which is used by researchers (Mahendra, Alice and Gopal, 2016). In the annual report, lots of information is provided of company profits, its expansion etc. This all information help in identifying the financial position of the company and its market share. Along with this, it includes company financial statement, income statements, cash flow statements and balance sheet. This show all show company overall expenses, current assets and current liabilities.
B.)
There is a different type of growth strategy which company can use for analysing its business that is as follows:
Market Development: Market Development is one of the best strategies for growth of business. According to this strategy, John Lewis can expand its business in the different geographical sector. The expansion of business leads to increase in market share by entering new market (Mahendra, Alice, and Gopal, 2016). John Lewis can sale its existing product in the new market for increasing the sale of business. This strategy main aim is to increase sale and capturing market share. John Lewis is one of the successful company which operates its business in different countries.
C.)
There is some limitation of trend analysis because all the information derived from actual historical results. Along with this it also uses for pro forma information and compares with the historical result for getting the consistency (Kogadeeva and Zamboni, 2016).


 Company