9 Top Power BI Dashboard Examples in 2025
Excel in using Power BI Dashboard Examples with assistance from Us!

23 Jan 2025
461


Excel in using Power BI Dashboard Examples with assistance from Us!
Get A+ Within Your Budget!
Price Calculator
Offers & Benefits
Get upto 55% OFF on
Your First Order !


Table of Content
Introduction to Power BI Dashboard Salient Features of Power BI DashboardOn this fast-paced planet, it is vital to adjust with time. If you fail to do it, you will be rejected and overlooked. As new technologies appear daily, you must acquaint yourself with these tools. So not only can you better yourself but also make an impression among your peers.
One such amazing tool is Power BI Dashboards. We will give you 9 Examples so you can have a basic idea of how they help you become a pioneer in your respective fields. Our collection will help you comprehend what yardsticks to include, which graphic elements to use, and even how to make your Power BI dashboard live. So, without any further ado, let us tell you all about power BI dashboard examples.
A Power BI Dashboard is a single page that tells a story through graphics and visualizations. It is also known as a canvas because it only contains the highlights of the story. Dashboards are basically a feature of the Power BI service. It is designed for different business professionals with varied levels of data knowledge.
These power BI dashboard samples can report and present data in various styles, including graphs, maps, scatter plots, charts, and more. It helps you to have a bird's view of the complete project at a single glance. In the upcoming heading, we will give you certain features that if you incorporate them into your BI board, will create an amazing impression on your audience. So, let us see what are those points.
Under this heading, you will learn how those features will impact the viewers when they peruse your power BI dashboard templates. You need to follow these pointers if you want a canvas that is clear and concise. Along with it, you must also provide basic information about the entire project. This tool helps students and professionals alike. Therefore, let us learn the features that make a great BI Dashboard. This tool also can help computer experts as they deal with these programming languages. If any issues occur, seek computer science assignment help from experts.
Microsoft has continued to fund heavily in evolving Power BI by adding monthly feature updates. With a dynamic online society, you can coax which new Power BI features get prioritized for expansion.
Excel worksheets come with an inbuilt standard limit of 1,048,576 rows. Though performance will slow in its way before the said limit, it is a common practice for users to analyze datasets over 1 million rows in size. Power BI condenses your data so you can draw insights from large datasets. With a well-built data prototype, it can help you study datasets holding over 100 million rows.
Although Power BI tools support many standard data visualizations, it is possible to build your custom data visualizations. By including open-source data viz libraries from R and Python, analysts can create their very own customized visualizations.
Excel can link directly to your underlying Power BI data so you can do your tabular and ad-hoc reporting. If you create Pivot tables in Excel, you can use this knowledge to cut and chop your data, referencing the same datasets utilized in other Power BI reports. It can also help you in the accounting sector as it will help prepare charts and reports. You can also seek accounting assignment help if you face any issues.
Power BI Dashboard Ideas can help you create interactive and insightful mapping data visualizations. It comes with three different map types that include Standard Map, Filled Map, or ArcGIS Maps for Power BI.
Power BI Dashboard helps you to import and transfer data from multiple sources with the aid of power query. As it is made with low/no code experience, it aids the analysts with SQL or programming language to transform, join, and manipulate their data with an easy-to-use interface.
Power BI tools help refresh your data without tedious, manual report updates. By quickly and accurately reviving your data, insights can smoothly surface and be shared among your group. If you face problems in writing about this topic, you can seek assignment help from experts.
It offers a rich set of apps for Android, iOS, and Windows 10 mobile devices. You can see mobile-optimized reports, share anecdotes with your peers, and set alerts within the mobile apps.
Orienting one version of the truth with many reports is a difficult task. It, more often than not, ends with inconsistent definitions of metrics and KPIs. One of the most attractive features of Power BI is that it can define measures in a data model and then reuse them among various interconnected reports.
It has made great advancements in integrating the company's Office 365 products with Power BI, such as Microsoft Word, and Microsoft PowerPoint.
Therefore, you saw what are some of the features of the Power BI Dashboard. It can help you to make your reports and datasets more accurate. It will also cause you to connect and concise them, so it becomes easy to understand and explain. You can use AI essay writer, if you face any problem in writing an assignment on this topic.
You saw the features that make a great Power BI Dashboard in the previous section. Now that you are well versed with what it means and its features, that helps students and professionals alike. It's time that we peruse some power BI dashboard templates that will give you a clearer idea about what the Dashboard looks like.
It becomes easy to understand any concepts when you study them with the help of some specimens. It provides a bulk of information in a jest and a simplified manner. So, in that light, you will, in this portion, see by yourself some of the best power BI examples for a more comprehensive understanding.
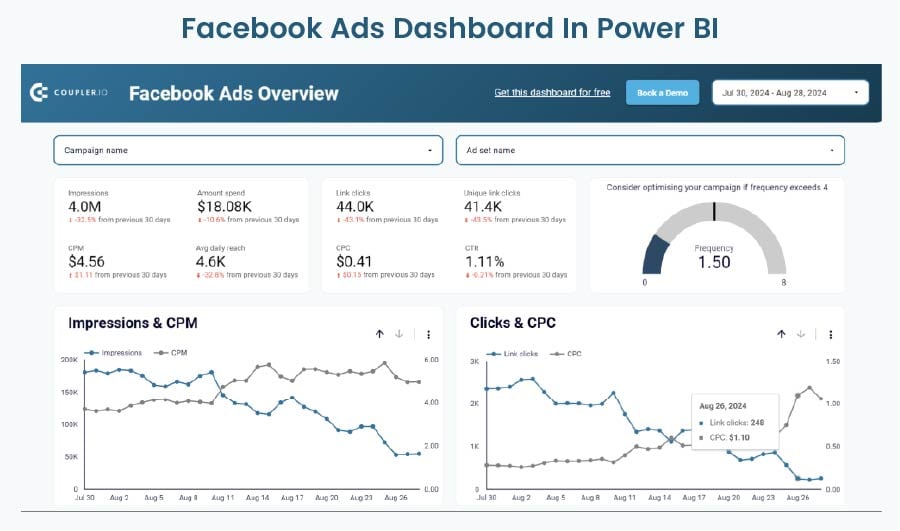
This dashboard helps you to monitor and study key metrics and view the campaign performance almost in real-time. It allows you to zoom in and analyze every campaign separately. It gets updated automatically, and also aids you in understanding audience insights. Moreover, it also includes monthly dynamic reports. From this blog, you get a basic idea about power BI dashboard ideas that you can use.
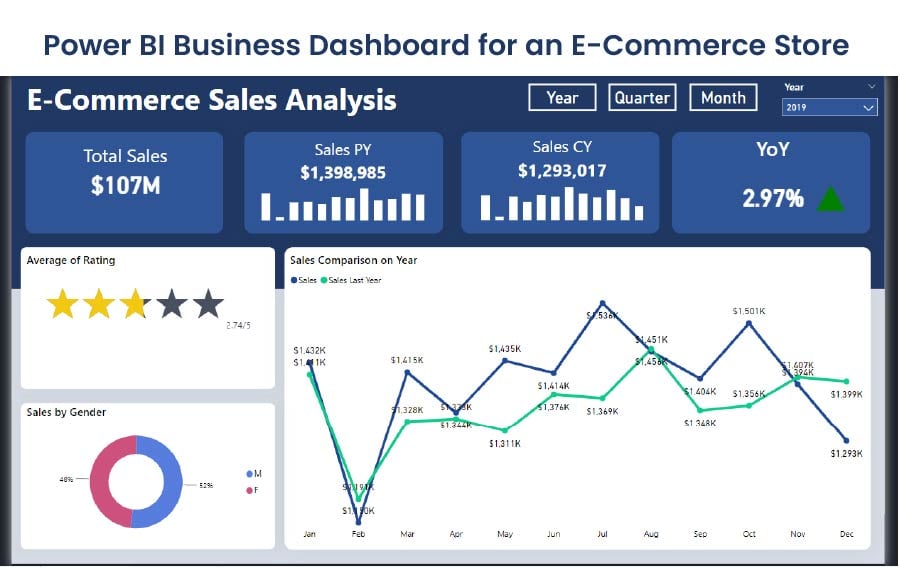
The e-commerce dashboard caters to online stores and service providers. It gives you a complete picture of the sales and conversion rate. You can identify potential roadblocks and develop strategies to solve those problems. Moreover, it also reflects scoreboards displaying the most vital KPIs, like conversion dynamic or customer lifetime value.
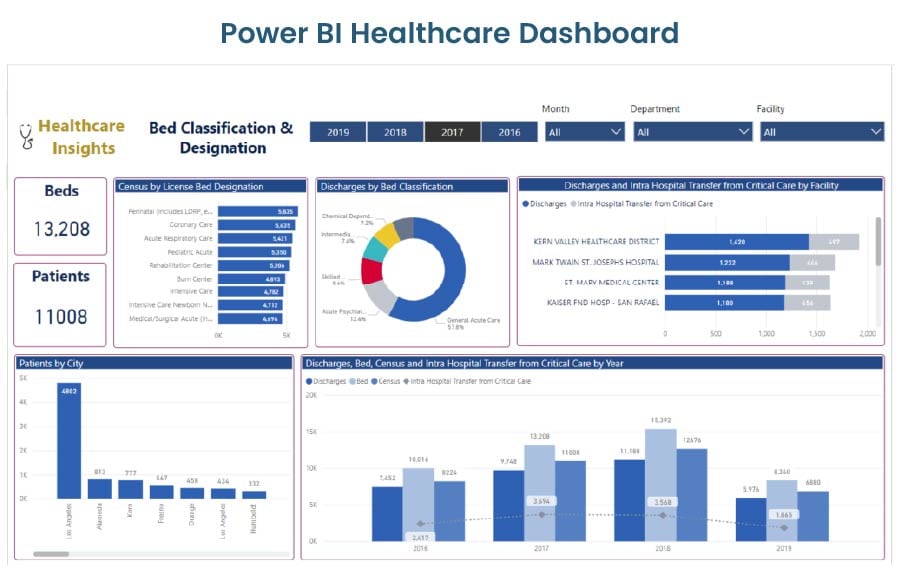
Under these power BI examples, you can see a hospital emergency response report. It gives the administration an idea about the availability of beds, patients' case status, and the equipment in use. In turn, it will help the hospital staff to check inventory and take necessary actions on that basis. It also provides an overview of all different reports and areas.
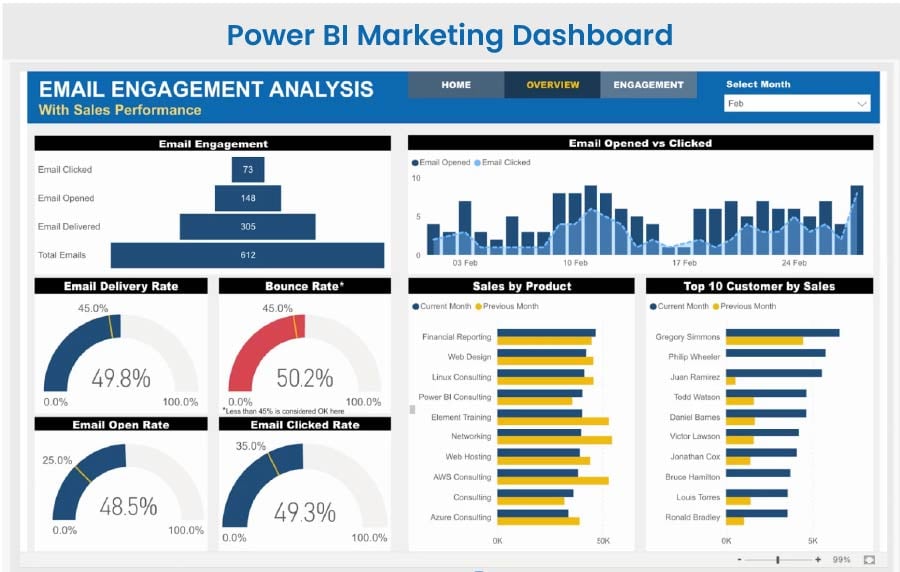
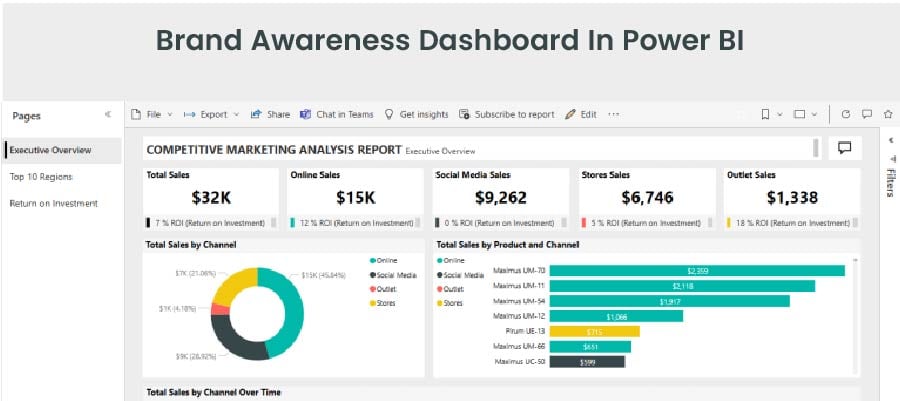
As the field of marketing is wide and many activities take place across its different sectors, this dashboard can prove extremely useful. The professionals can make various dashboards to keep track of all the activities. It also gives an easy view of how these different marketing activities are helping in the sales of products across the entire chain.
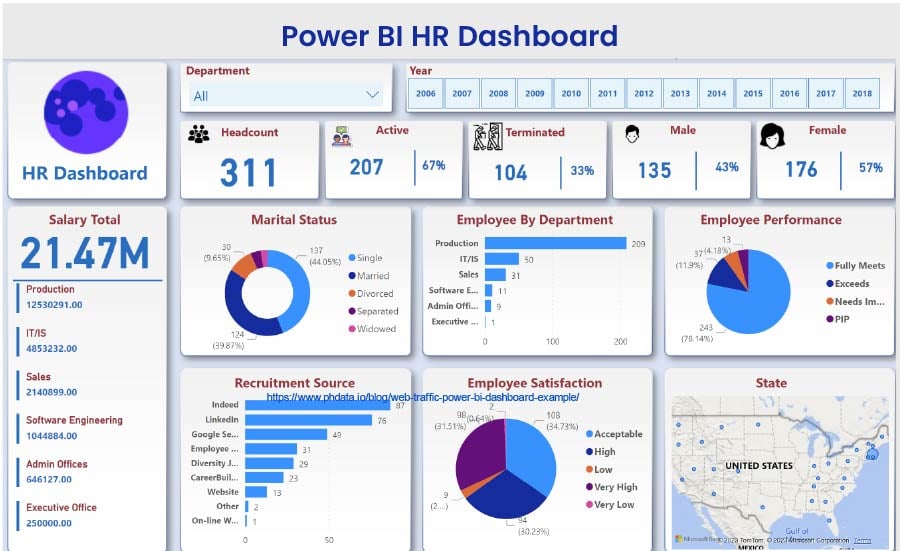
Under this dashboard examples of power BI, the HR department can keep track of the hiring history of the employees. They can keep a report of new hires, present working employees, and the people who left the company. It can also help them to employ people of all ages, gender, ethnicity, and race. In turn, it will aid the administration sector to make sure that there is equality in the organization and the absence of any bias.
These power BI examples help you to understand the expenses spent on the IT department. It will allow you to see all the changes and variables that are changing in the sector. It will, in turn, aid the executives in making a plan about whether they should put more funds in the area or curb them. Hence, it will also help them to make any vital changes.
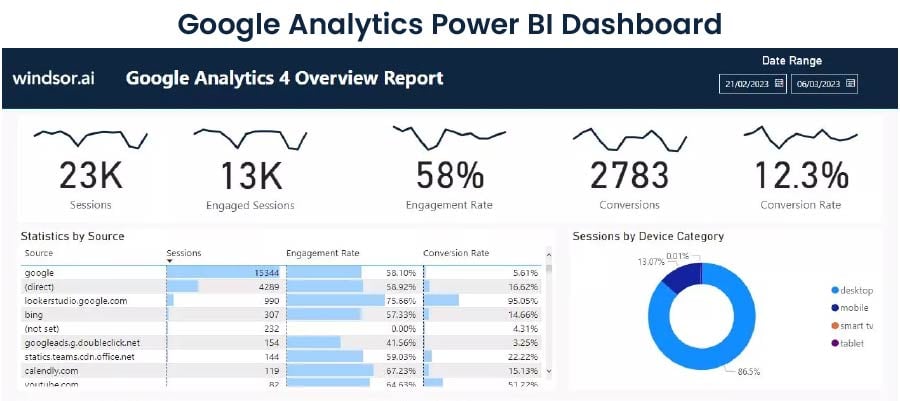
These best power BI dashboard examples will help the experts understand the trends taking place in the world. It collects data from the search engine and various other sources and analyzes the influx of traffic on the webpage. It will also help you make necessary changes that will help bring in traffic to the site.
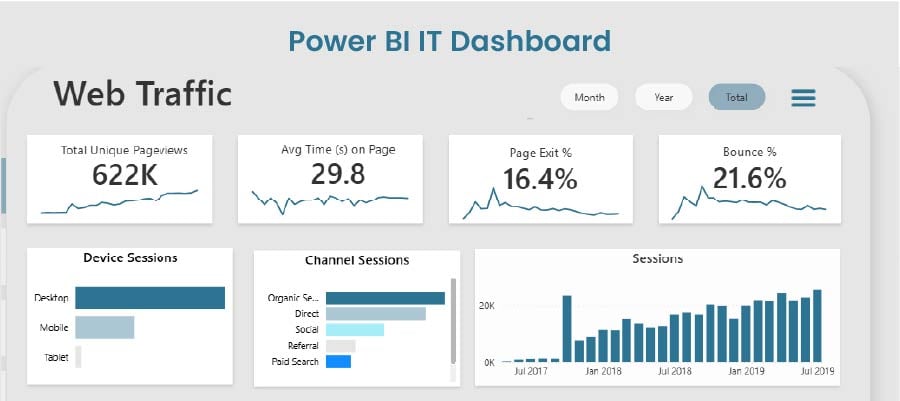
Under this power BI project, you will be able to see the traffic that the website draws regularly. It will help the professionals to see how many new users visited the site and for how long they were there on it. It will also help them to make custom reports and analyze metrics on how to improve the overall working of the website.
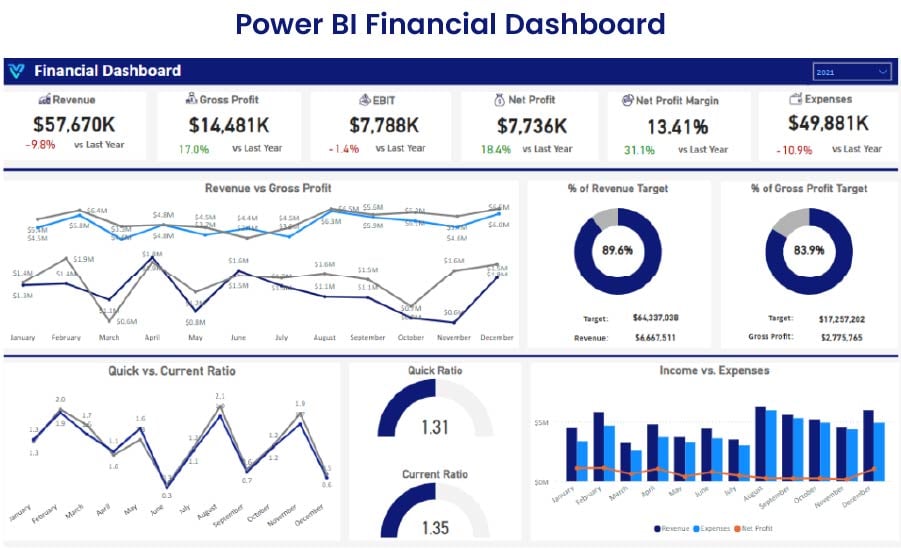 These power BI examples aid the executive of a company in visualizing its financial health. It will help them to see what are the expenses, losses, and profits occurring on a regular basis. It will also aid them in making custom reports and study metrics through which they can make vital changes in the company. Therefore, it is a vital tool for any finance expert.
So, you saw what the Best power BI dashboards examples are and their features at great length. You can, with the help of MATLAB assignment help get an idea about this tool. It will also aid you in improving your professional personality if you know the use of this tool which is taking the world by storm.
Your teacher can always give you assignments to write on this topic, and if you face issues, you can take help from experts .It will help you not only write it but also help in keeping your content free from any faults.
In a sales department, it can help the experts to prepare reports of the highest-performing KPI in the sector. It also helps you to analyse and prepare metrics that will help in understanding the working of the company./p>
You can use Power BI to give the audience a bird’s view of the functions that your company undertakes. It will help them to understand the basics what your firm deals with.
You can become familiar with the basics of Power BI tools within 4-6 weeks. You can install and become acquainted with it from the comfort of your home.
If it is simple to use and understand or it provides you with a grid layout which is easy to navigate. The most important quality of a good BI dashboard should be that it load time should be faster.
Limited Time Offer
Exclusive Library Membership + FREE Wallet Balance
1 Month Access !
5000 Student Samples
+10,000 Answers by Experts
Get $300 Now
![]() Update your Number
Update your Number